Kansas Geological Survey, Open-file Report 2007-1
A Briefing to the Kansas Legislature- House Agriculture and Natural Resources Committee
by
Brownie Wilson
KGS Open File Report 2007-1
January 17, 2007
The complete paper is available as an Adobe Acrobat PDF file.
KGS_WaterLevel_KSLegBrief.pdf (7.07 MB)
To read this file, you will need the Acrobat PDF Reader, available free from Adobe.
KGS Open File Report 2007-1 |
|
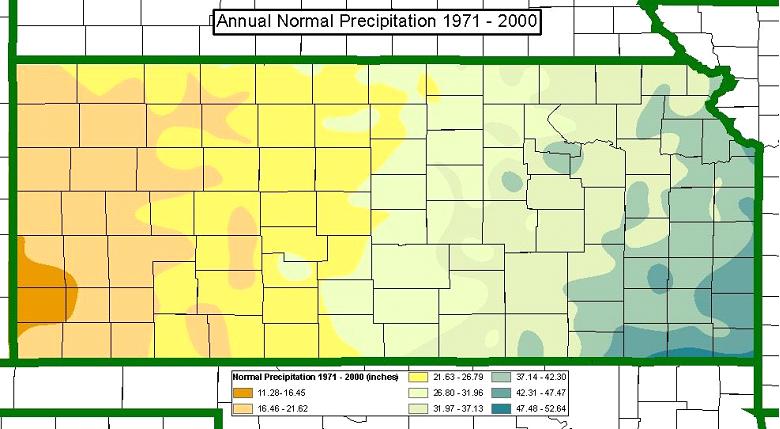 |
Figure 1 – Annual Normal Precipitation in Kansas (Source: KSU Weather Library). Normal precipitation is defined as the average total precipitation over the last 30 year decal period, in this case, 1971 to 2000. Precipitation patterns in Kansas have major influences on the landscape, water resources, and uses made of water in the state. |
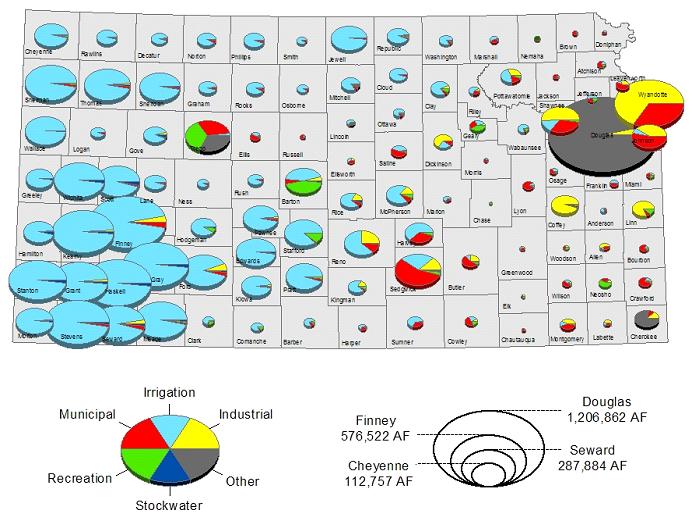 |
Figure 2 – Total Authorized Water Right Allocations, by County. Water right allocations represent how much water and for what purpose can be diverted each year. In general, municipal and industrial uses are more prevalent in eastern and south-central Kansas while irrigation dominates in western Kansas . Much as this is influenced by the precipitation patterns and available water sources. |
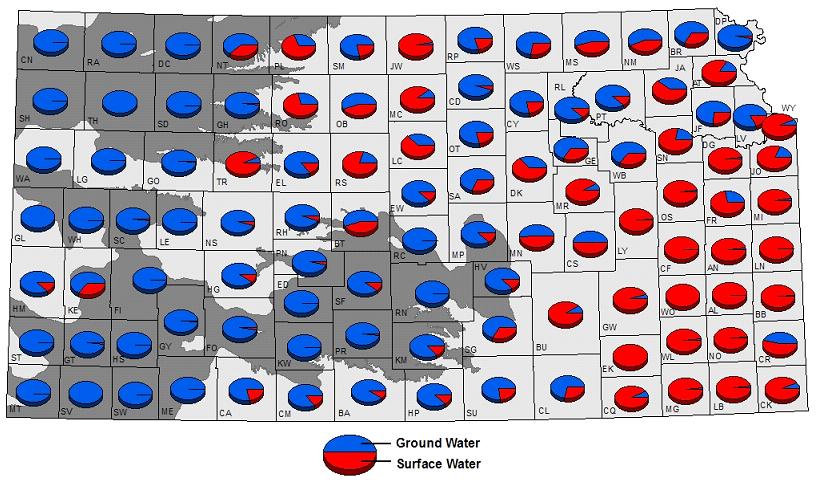 |
Figure 3 - Proportion of Allocations by Water Source and County. In general, surface water is the primary source in eastern Kansas (red) and with ground water in western Kansas (blue). The gray shaded area in western and south-central Kansas is the primary saturated extent of the High Plains (HP) aquifer. The HP aquifer is the primary water source for virtually all uses in this area. |
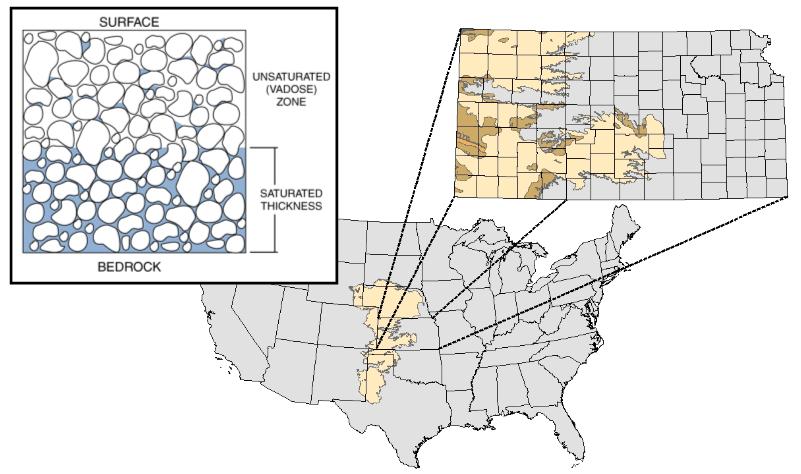 |
Figure 4 – The High Plains (HP) Aquifer. The HP aquifer is one of the largest most accessible ground-water systems in the world. It covers eight states in the continental United States running from South Dakota to Texas. The HP aquifer is the single greatest ground-water resource in Kansas. Often the HP aquifer is called an “underground reservoir”. This implies a person with the proper scuba equipment and access can go swimming underground. This is hardly the case. Water in an aquifer is stored within the pore space between geologic layers as shown by the exaggerated illustration. |
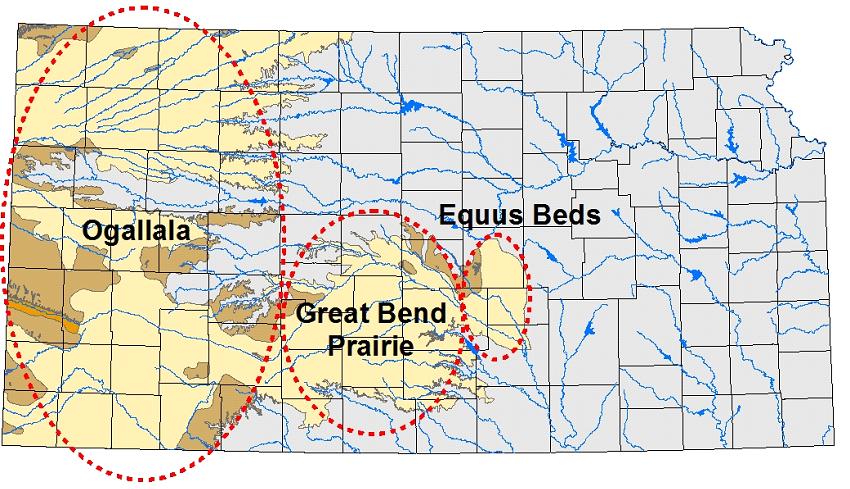 |
Figure 5 – Sub-Regional Aquifer Systems. In Kansas, the HP aquifer is made up of several smaller sub-regional aquifers-- the Ogallala, Great Bend Prairie and Equus Beds. On a national scale, many people and publications will refer to the HP aquifer as the Ogallala. In Kansas, we make a distinction. The Great Bend Prairie and Equus Beds aquifers are generally closer to the land surface (not as deep) and are more responsive to recharge. They are managed as sustainable systems. The Ogallala is generally deeper and, with less annual precipitation, has little natural recharge. Recharge estimates for the Ogallala generally range between 0.5 to 1 inch annually. |
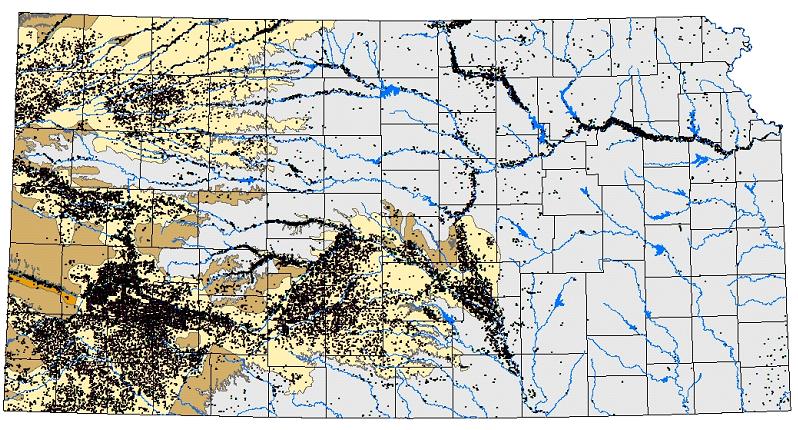 |
Figure 6 – Ground-water Well Development for Water Rights. This map does not include the majority of domestic wells; rather it shows the larger production wells that are required to have a water right. Ground-water development in eastern Kansas is generally confined to alluvial aquifer systems that closely are tied to stream/river surface water flow. The importance of the HP aquifer can readily be seen by the amount of development in south-central and western Kansas. |
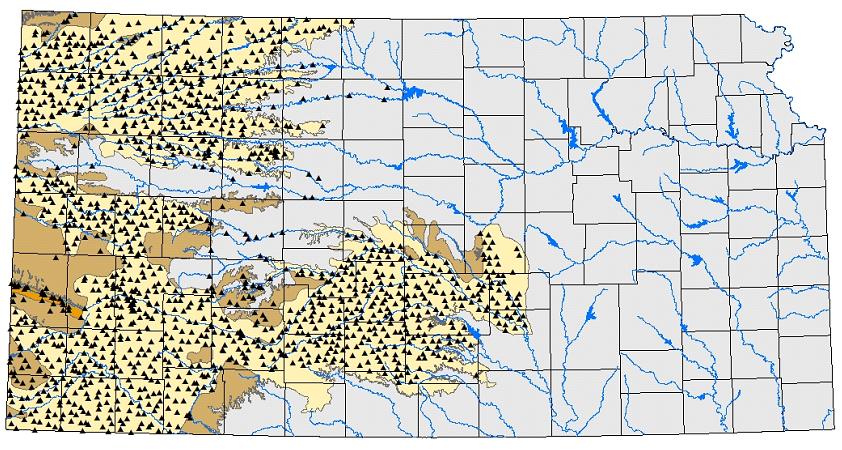 |
Figure 7 – Kansas Cooperative Water-Level Measurement Network. Because of its importance to Kansas, the HP aquifer is the focus of the KGS/DWR cooperative ground-water monitoring program. Each winter, when irrigation is at its lowest level, the KGS and DWR measure the depth to water in roughly 1,400 wells. These wells are shown by the black triangles on the map. In addition, the KGS collects water-level measurements across the state from other agencies, such as the DWR field offices and local Groundwater Management Districts (GMDs), shown by the black triangles. All this data can be access from the online KGS WIZARD database at http://www.kgs.ku.edu/Magellan/WaterLevels/index.html. |
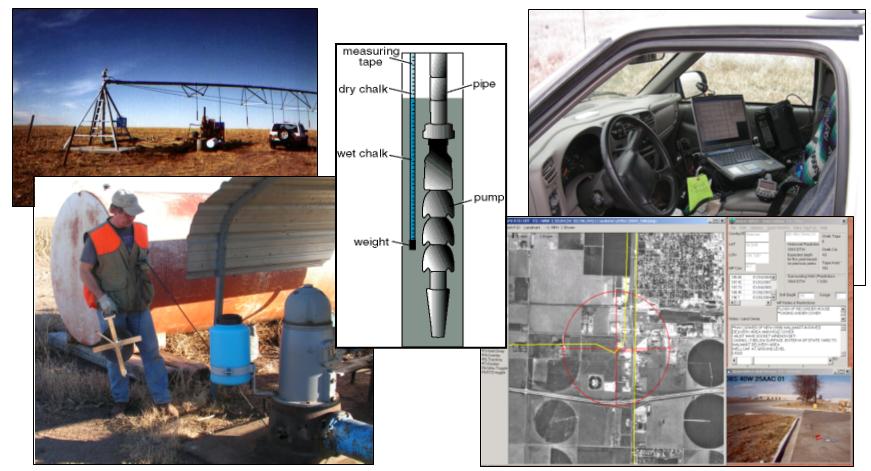 |
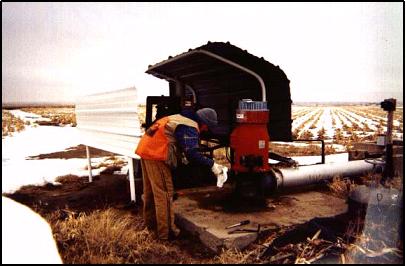
Figure 8 – Field Collection. The monitoring program makes a great effort to measure the same wells every year. The KGS developed customized software tied to global positioning systems (GPS) to assist in finding the wells in the field and store information. The depth-to-water is measured using a steel tape that is incremented to the hundredth of a foot. The bottom of the tape is covered with blue chalk. When the tape is lowered in the well, it crosses the water table and makes a very clear and distinct mark on the chalk covered tape which is called the “cut”. The depth to water can then be calculated based on the distance from the top of the well to the cut. |
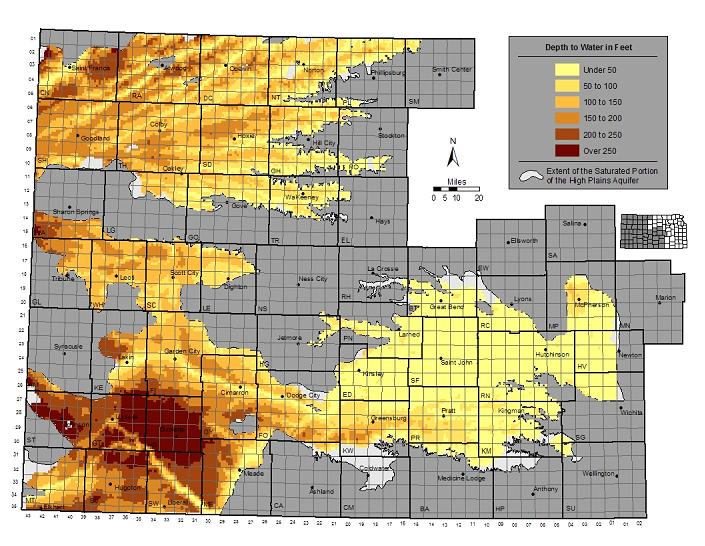 |
Figure 9 - Average 2004 to 2006 Depth to Water for the HP Aquifer. We often use three-year averages since some wells can not be measured every winter for a variety of reasons or some wells are measured multiple times. The Ogallala (in western Kansas) is very diverse in the depth to water but overall it is deeper than the Great Bend Prairie and Equus Beds (in south-central Kansas). |
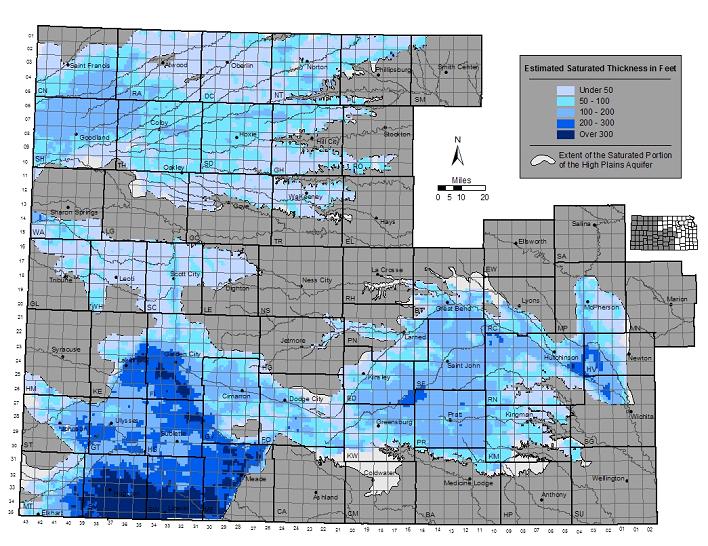 |
Figure 10 – Average 2004 to 2006 Saturated Thickness for the HP Aquifer. Saturated thickness is the vertical feet of water in the aquifer (water table elevation or top minus the bedrock or bottom) and is often used as a proxy for the amount of water in storage. For the Ogallala aquifer, southwest Kansas has in the past and is today relatively water rich compared to west-central and north-west Kansas. |
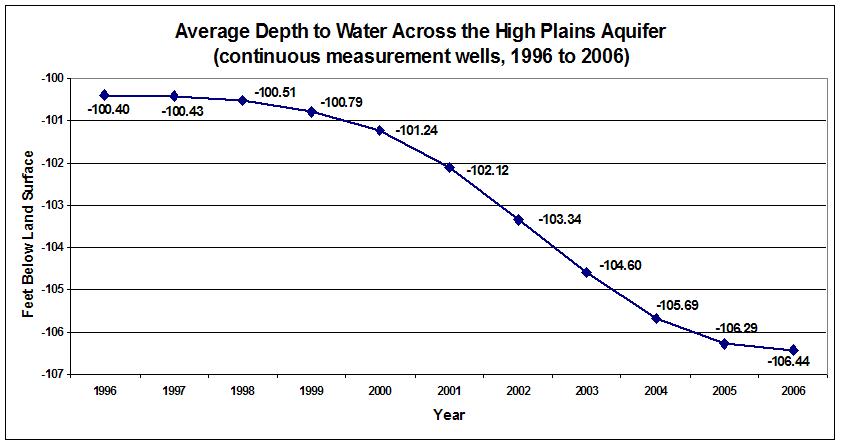 |
Figure 11 – Depth to Water Trends. The average depth to water for all the wells measured from 1996 to 2006 across the HP aquifer is roughly 100 to 105 feet below the land surface. “Continuous measurement wells” are wells that were measured each and every winter from 1996 to 2006. The start of drought conditions in the state in the year 2000 can readily be seen. For the Ogallala aquifer, the influence of precipitation (or lack thereof during a drought) is not directly tied to changes in the water table. Rather precipitation influences pumping and ground-water extraction levels, which in turn influence changes in the water table. |
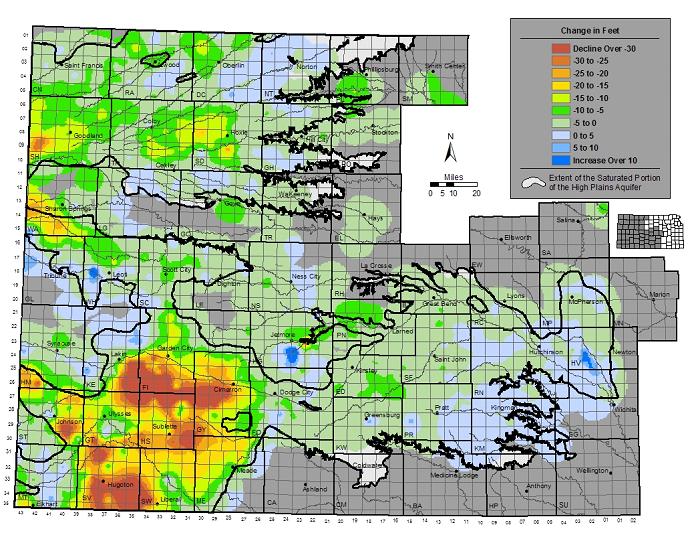 |
Figure 12 – Interpolated Change in the Water Table, 1996 to 2006. Water level changes should be viewed in combination with the saturated thickness of the aquifer. Although some areas of the HP aquifer have declined over 30 feet since 1996, other areas with lesser declines may be more significant if there is less water in storage. This map shows changes at all monitoring wells. Other deeper and less-used aquifer units, such as the Dakota Aquifer and other older sediments, are also shown. Click here to see an animated version of this map and click here to view the legend. |
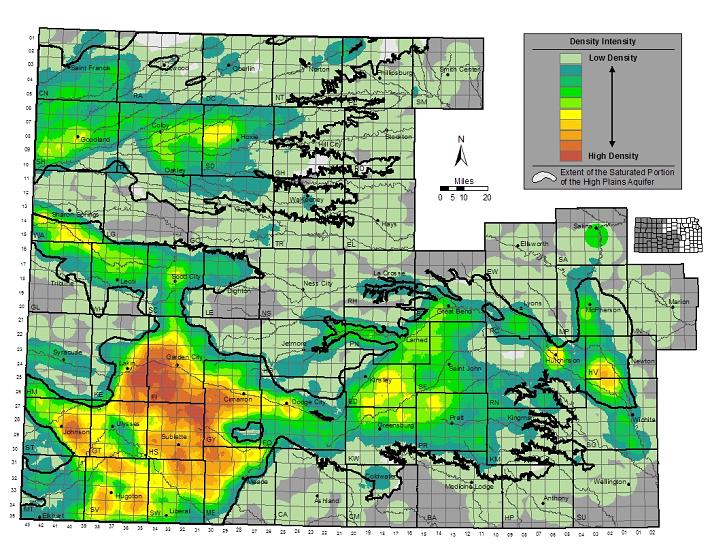 |
Figure 13 – Density Distribution of Average Reported Ground-Water Used from 1996 to 2004. Particularly in the Ogallala aquifer region with its relative low annual recharge rates, decline areas outlined in the previous slide correspond to high water use areas. This further supports the relationship between the influences of precipitation patterns on ground water pumping, which then in turn affects changes in the water table. |
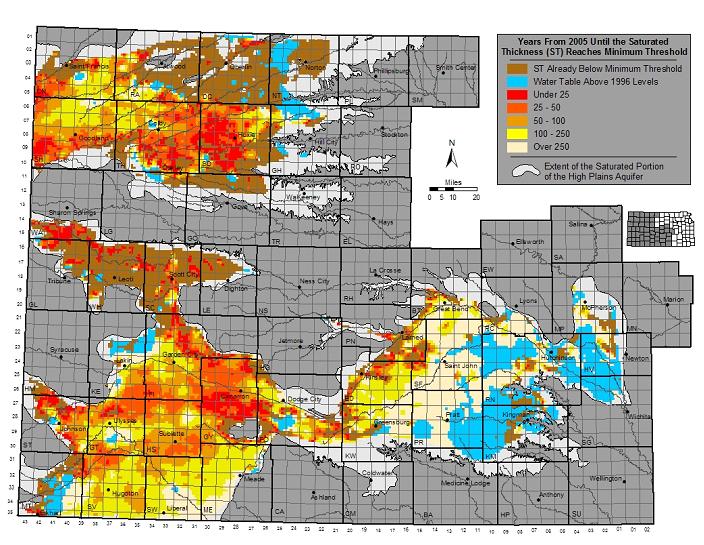 |
Figure 14 – Estimated Usable Lifetime. This map is an estimated projection (NOT A PREDICTION) of how many years until the HP aquifer reaches a point where wells requiring 400 gpm extraction yields will begin to be impaired if ground-water level trends from 1996 to 2006 repeat continuously and unchanged into the future. This methodology is only suitable to the Ogallala portion of the HP aquifer because of its very small annual recharge levels. South-central Kansas does have local issues of ground-water declines but given higher precipitation and recharge levels, this area of the state has a much greater potential to recover. |
Kansas Geological Survey, Geohydrology
Placed online January 12, 2007
Comments to webadmin@kgs.ku.edu
The URL for this page is http://hercules.kgs.ku.edu/geohydro/ofr/OFR2007_1//index.html