Introduction
WIZARD is an acronym for Water
Information Storage and Retrieval Database (Hausberger et. al., 1998) and
represents a repository of information on fresh-water wells drilled into
aquifers in Kansas. It contains
data on well locations, trends in depth-to-water, well construction, and casing
by consolidating information maintained by several local, state, and federal
agencies.
Its primary purpose is to archive
water-levels measured at various times of the year for wells that are part of
the statewide or local water-level observation networks. Most of these data consist of annual
measurements of the depth-to-water taken over the winter months, but some wells
are measured quarterly or monthly.
WIZARD contains over 52,000 well
location records across Kansas
with roughly 6,850 containing historic depth-to-water measurements stored in an
Oracle-based relational database management system consisting of 19 related
tables. Except for basic location
information, data are not complete for all wells. Although water-level measurements can be
found statewide, most are concentrated in the High Plains aquifer region of
western and south-central Kansas. Data are updated throughout the year.
The WIZARD database evolved from
the United States Geological Survey’s (USGS) Ground Water Site Inventory (GWSI)
in 1996. This legacy still exists in the
use of the USGS_ID field, which serves as a unique identification number for a
well site location. However, WIZARD is
owned and maintained solely by the KGS while GWSI is operated solely by the
USGS. There is no formal coordination
between the two data sources.
This report will outline and
explain the functions and capabilities of the WIZARD web site. This report was developed in support of the
Maintenance and Enhancement of the High Plains Aquifer Information Network,
funded by through the Kansas Water Research Institute, Dave Young, Principal
Investigator.
Internet Browser Requirements
The
WIZARD web site was developed and tested using the Netscape (version 7.0) and
Internet Explorer (version 6.0) web browsers.
For the WIZARD web site to function properly, the accessing browser must
support frames, Java scripting, cookies, and popup windows.
Accessing the WIZARD Web Site
Most
of the information in the WIZARD database (with some exceptions) is available through
the WIZARD web site:
http://www.kgs.ku.edu/Magellan/WaterLevels/index.html
The
site may also be accessed via the Kansas Geological Survey (KGS) main web page
(http://www.kgs.ku.edu/)
by clicking on the “WIZARD”
hyperlink under the bullet labeled “Water”.
Well Selection Page
The
WIZARD web site starts with the Well Selection Page (shown below) and allows a
subset of wells to be selected from the main database. The “Please
Note” section of the page is dynamic and serves to announce special events,
such as the loading of raw field data or any downtime for database maintenance.
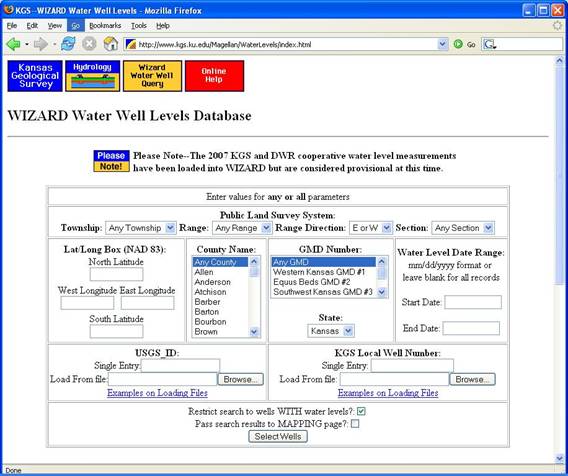
At
the top of the well selection page are links to the KGS, information related to
water resources in Kansas, and WIZARD online help which is a link to this
report.
WIZARD
water wells can be selected by entering criteria into one or more of the text
boxes and/or choosing items from the list boxes on the selection page. The well selection criteria are summarized
below:
Public Land Survey
System.

A
Public Land Survey System (PLSS) tract may be used as a selection
criterion. One simply enters the desired
township, range, range direction, or section in the appropriate box or chooses
these items from a list (shown above).
If any of these items is not to be used as a selection criterion, the
default values should be chosen.
Example: In what follows, all the wells within the
township at 22S 15W are to be selected, regardless of the section number a well
may be located in:

For
more information on the PLSS and to view a reference map, see the KGS PLSS Public
Information Circular at http://www.kgs.ku.edu/Publications/pic20/pic20_1.html
Lat/Long Box (NAD83)
This
option allows the user to specify a bounding box in latitude and longitude coordinates
for the well selection. Valid entries
must be in decimal degrees and based on the North American Datum of 1983 (NAD1983). Both positive and negative values of longitude
are valid. For the entire state of Kansas, longitude ranges from about -94.6 degrees in the
east to -102 degrees in the west.
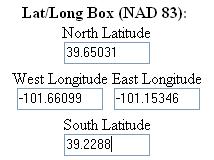
In
the example shown above, all of the wells within the geographic box defined by
the (Longitude, Latitude) coordinates (-101.66099, 39.65031) in the northwest
and (-101.15346, 39.2288) in the southeast are to be selected.
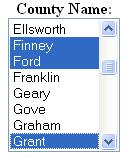
County Name:
Users
may also select wells within chosen counties.
One or more Kansas counties can be chosen from the list on the selection
page by clicking on the county names. To
choose multiple counties, hold down the CNTRL key while clicking on the
name. To select a contiguous block of
counties, click on the first name in the block, then hold down the SHIFT key
and select the last name in the block.
If Kansas counties are not to be part of the selection
criterion, choose “Any County” (the default) from the list. In the example that follows, all of the wells
within Finney, Ford, and Grant counties are to be selected.
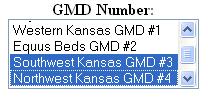
GMD Number:
Wells
within one or more Groundwater Management Districts (GMDs) can also be used as
a selection parameter. This is done in a
manner similar to selection by county.
Simply choose one or more GMDs from the list on the selection page by
the same procedure described above for selection by county. Choose “Any GMD” (the default) if selection
is not to be done using GMD as a criterion.
An example in which all wells within Southwest Kansas GMD#3 and Northwest Kansas
GMD#4 are to be selected follows:
For a map of the GMDs in the
state, see http://www.kgs.ku.edu/Hydro/gmd.html.
Water Level Date Range
In
addition to the location of well sites, the selection process may be further
refined based on when depth-to-water measurements were taken. For this option, enter a start date and end
date in the appropriate boxes. Most standard date formats are accepted, but the
mm/dd/yyyy is the default format. In the
example below, all of the wells measured from January 10, 1985, to October 12, 1996, will be selected:
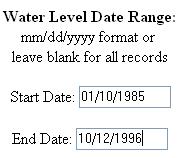
If the start and end date
boxes are left blank (the defaults), these parameters will not be used as a
selection criterion the entire measurement history for the selected well
locations will be included.
USGS ID or KGS
Local Well Number
Each
of the wells in the WIZARD database can be uniquely identified by either their primary
identification number (USGS_ID) or a derivative, the KGS Local Well Number (See
the Appendix A for definitions of these identifiers). This option allows selection of a single well
by typing either identification number in the appropriate box on the well
selection page (see example below).
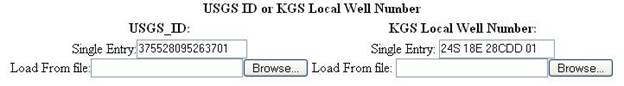
In
this example, entry of the USGS_ID and Local Well Number are demonstrated. However, only one of the identifiers is
needed to select a specific well. Leave
the appropriate box(es) blank if either or both of these criteria are not to be
used as selection criteria.
Multiple
wells may be selected by their ID numbers by creating an ASCII file (using an
ASCII editor like NotePad or WordPad) containing a list of USGS_IDs or Local
Well Numbers. Once the ASCII file is
created, click on the browse button to navigate to its location. An example follows:
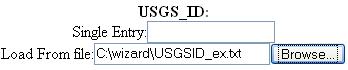
The
exact full path and file name may also be directly entered into the appropriate
box if it is known. Users are STRONGLY encouraged to use the BROWSE button to locate the
file. If a path and file name are incorrectly
typed in, the web site will, through an error message, notify you that it can
not find the file. Using the navigation
features of the browse button helps avoid this.
The
USGS_IDs or KGS Local Well Numbers listed in the ASCII files must follow the
format example shown below:
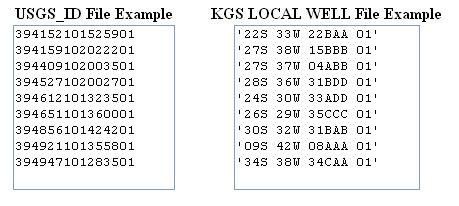
Note that the Local Well
Numbers must be within single quotation marks since they contain embedded
spaces.
Other Options on the Well Selection Page
Of
the over 52,000 well records in WIZARD, only about 13% have water level
measurements stored in the database.
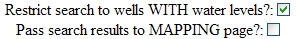
Checking the option to “Restrict search to wells WITH water levels” limits
the selection to those wells that actually have depth-to-water measurements
stored in WIZARD. This option is checked by default (see example below).
Given
its historic legacy to GWSI, the WIZARD database may contain well records found
in no other state or federal database.
Although many of these well records do not contain historic
depth-to-water measurements, they are still useful for understanding past
ground-water well development. To access
many of these site locations, the “Restrict search to wells WITH water levels?”
must be turned off by clicking on the check box, which removes the check mark.
The
“Pass search results to MAPPING page?” check box controls where the results of
the selection criteria will be passed.
Un-checking the box (the default) will pass the search results to the
Well Listing Page, which itself has an option to access the mapping page. Checking the box passes the search results
directly to the WIZARD mapping page.
Both the Well Listing Page and the Mapping Page are discussed later in
this report.
Select Wells

Once
all the selection criteria from the Well Selection Page have been established,
click the “Select Wells” button to initiate the query. The web site conducts some simple error
checking, such as if an entered North Latitude value is really a number. If a problem with the selection criteria is
found, an error message is displayed outlining the problem area of the
query. Hitting the “Back” button on the
browser will return to original selection page where the problem criteria can
be adjusted.
Upon
passing the error checks, the selection criteria will be run against the WIZARD
database to select all the matching wells.
Depending on the other options specified on the Well Selection Page, the
results of the query will be displayed in either the Well Listing Page or the
WIZARD Mapping Page. A message will be
displayed if no well records were found to match the selection criteria.
Well Listing Page
The
Well Listing Page is a listing of the selected well records (displayed 50 at a
time) that match the criteria specified in the Well Selection Page. To view a specific 50-record portion of the
list, click on the appropriate range at the top or bottom of the list. Just below each column label are options to
sort the displayed list into ascending (asc) or descending (desc) order. For the “Date Range” column, one may sort (ascending) by the earliest
date of measurement (Min Date) or (descending) by the most recent date of
measurement (Max Date) for a well.
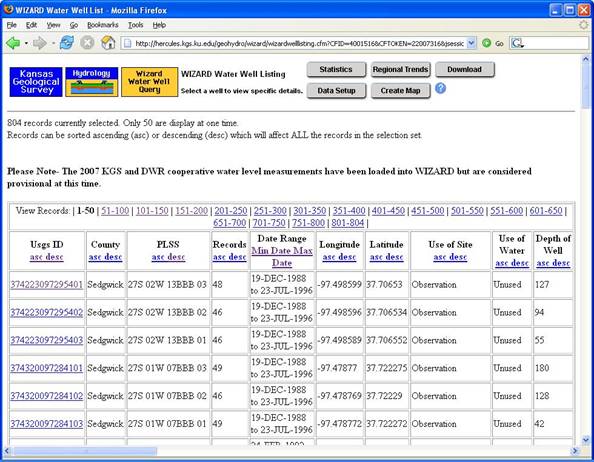
The
Well Listing Page also provides options for further computations and data
displays for the either the group of selected wells or individual well site
locations. Clicking on an individual
USGS_ID of a well from the well list will open the WIZARD Well Details Page while
clicking on the processing buttons at the top of the page will perform a
variety of tasks on the selection set as a whole. All of these options are discussed in the
following sections of this report. On
any page in the WIZARD web site, the blue button with a question mark label
links the user to the site-specific help.
Well Listing Page- Well Details Page
Clicking
on an individual USGS_ID from the WIZARD Well Listing page opens Wizard Well
Details page. This page provides
detailed information for individual wells.
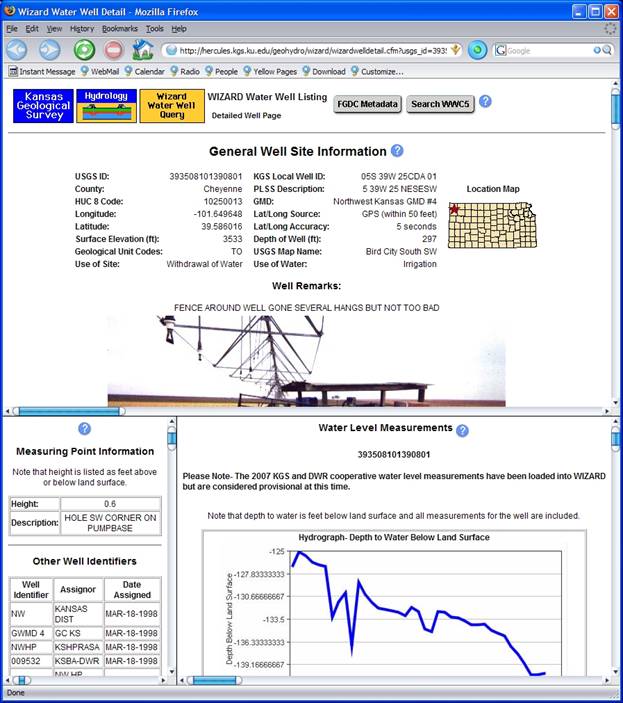
As
can be seen from the figure above, the page consists of three frames, each of
which can be scrolled through and resized.
The top frame contains general well site information such as the
longitude and latitude of the well location, the land surface elevation, the depth
of the well, etc., along with a well location map, remarks concerning the well,
and in some cases, a photograph of the well.
The bottom left frame contains measuring point information such as
height in feet above or below land surface, other well identifiers (identifiers
assigned to the well by other agencies), and in some cases, construction data
and casing data for the well. The bottom
right frame contains a graph of the entire depth to water measurement record
for the well followed by a table listing of the depth-to-water measurement
data. This table listing of
depth-to-water measurements can be downloaded by clicking the “Download” button
at the bottom of the table. This passes
the measurement history to a new web page that, in turn, can be saved or copied
and pasted into an ASCII file or spreadsheet.
At
the top of the WIZARD Well Details Page is a link to the WIZARD FGDC metadata (http://hercules.kgs.ku.edu/geohydro/wizard/wizardfgdc.html).
Discussion of FGDC metadata is beyond the scope of this manual but clicking on
the “FGDC Metadata” button will provide a complete explanation and breakdown of
several WIZARD tables and database fields. This metadata window will provide
information about the data items listed in the file header records and on the
well details page as well as other useful information regarding the WIZARD
database.
The
“Search WWC5” button, when clicked, presents a listing of any Water Well
Completion Form Database (WWC5) records within the (PLSS) section where the
well is located. The WWC5 database (http://www.kgs.ku.edu/Magellan/WaterWell/index.html)
is a separate well repository that provides information reported from drilling
companies about the lithology, location, type, use, casing, nearest source of
contamination, etc., of wells drilled in Kansas since 1974.
Although a single well site may be entered in both WIZARD and WWC5, there
is no established link or coordination between the two databases. Associations between the two database records
can be made based on common data attributes like a well’s location and its
depth.
For explanation of some of
the well characteristics displayed on the details page, see Appendix A.
Well Listing Page- Group Processing
The
group processing options at the top of the Well Listing Page provide several
statistics and data processing and mapping tools that operate on the entire
selected well set. These tools are
useful for general investigations of the data or to further process the
selection set for other applications.
Summary Statistics and Histogram
Clicking
the “Statistics” button at the top of the Wizard Well Listing Page provides
some summary statistics and a histogram for all depth to water measurements within
the selection set:
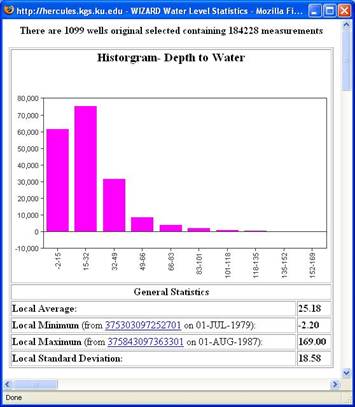
At
the top of this page, the number of selected wells and the number of associated
depth to water measurements are printed. The histogram depicts the distribution
of depth to water values. Rolling the mouse over a histogram bar displays a
message that gives the number of depth to water measurements that are within
the corresponding depth to water interval along with the range of this interval.
The ranges of the depth to water
intervals corresponding to histogram bars are printed along the abscissa
(horizontal axis) of the graph.
Following
the histogram is a breakdown consisting of the local average, minimum, maximum
and standard deviation of the depth to water measurements for all of the
selected wells. The entries with the labels “Local Minimum” and “Local Maximum”
in the general statistics table also contain the USGS_ID of the well from which
the statistic was derived and the date of its measurement. Clicking on the USGS_ID
opens the WIZARD Well Details Page of this well.
Regional Trends
The
Regional Trends button opens a window that displays a graph of the yearly
average depth to water for the selected wells versus measurement year followed
by a table containing the number of wells, the number of measurements, and the
yearly average for each available measurement year.
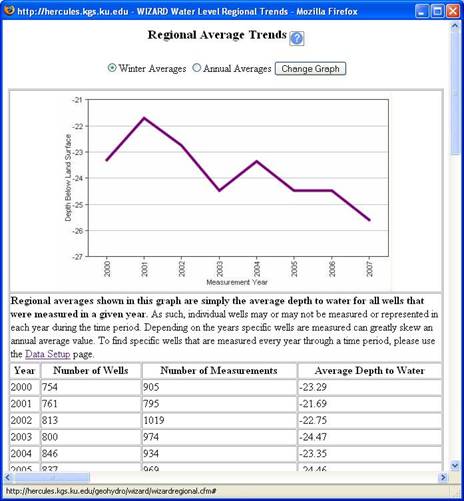
The
regional average depth to water is based on all of the selected wells measured
in a given year. There are two averaging
options provided at the top of the window in the form of radio buttons. Winter averages, the default option, causes
the annual averaging to be computed for a period consisting of December of the
previous year, January and February of the current year. For example, the winter average for the year
2000 is the average depth to water for all measurements made in December 1999,
January 2000, and February, 2000. The
“annual averages” option causes the averaging process to be done over the whole
calendar year. Hence, the yearly average
depth to water in this case would be the average of all measurements taken from
January to December, 2000. If the
averaging option is changed, the “Change Graph” button must be clicked to
update the window.
Note
that individual wells may not have been measured for every year of the time
interval; hence the yearly averages can be greatly skewed. It is important to note the number of wells
and measurements used to determine the yearly average. The time interval for the graph is based on
the date range entered in the WIZARD Well Selection Page. If none was entered, all measurements for the
selected wells are considered, hence the time interval would span a period from
the earliest measurement to the most recent of any well in the selection set.
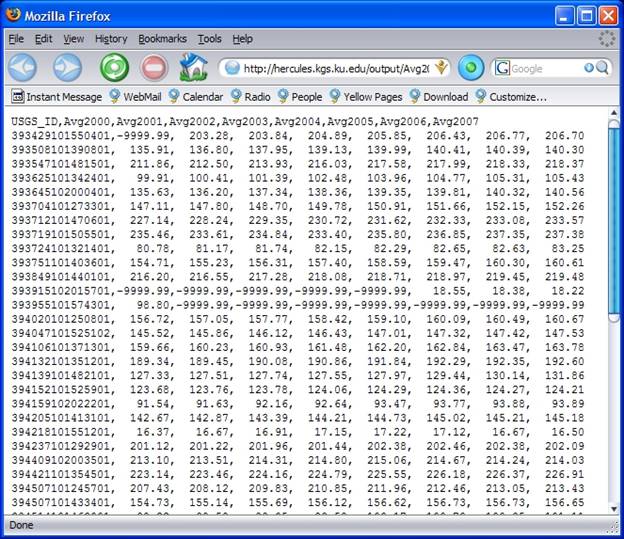
Download
This
option enables both the site-specific and water level data for all of the
selected wells to be downloaded. This button will open another browser window
(shown below).
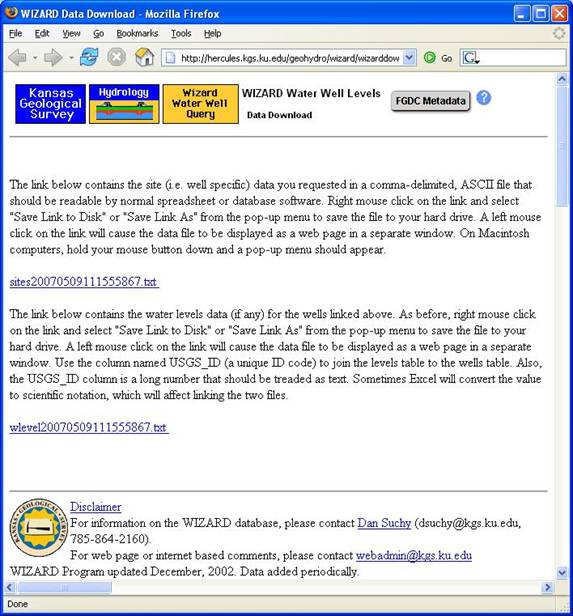
Two
comma-delimited ASCII files are included with the download option-- one for
well site specific information and another storing the water-level measurements
for those selected sites. The data relationship
between the two files is one to many in that a single well (one) may have
multiple measurements (many).
The
site-specific data file name always contains the “sites” prefix followed by a
time stamp. The file contains
information relative to the individual well sites, such as PLSS location data,
land surface elevation, well depth, and screened aquifer codes to name a few. The water levels data file name always
contains the “wlevels” prefix followed by a time stamp. This file contains the depth-to-water
measurements for the wells listed in the site file. The date range of the measurements is based
either on the “Date Range” from the Well Selection Page or the entire period of
record if no date range was specified.
Both
downloaded file options preserve the original data and field names stored in
the WIZARD database. Some of these
values are decoded throughout certain sections of the WIZARD website. For example, the WIZARD database stores the
name of the county a well is located in by its FIPS code whereas the WIZARD
Well Detail Page converts this to its actual name (e.g., Cheyenne County’s fips
code is 23). The download page provide a
link to the FGDC metadata that lists the exact values for every field in the
WIZARD database. Similarly, Appendix A
of this report provides code listings used in the WIZARD website.
Left-clicking
on the file name causes the file to be displayed in a new window;
right-clicking on it enables the user to save the file to a disk. On MacIntosh
computers, the mouse button is held down and a pop-up menu appears. Once downloaded, each file can be imported
into a spreadsheet or database and a data link or relate can be created via the
USGS_ID fields.
Data Setup
For
each well record in the WIZARD database, there may be zero or more depth to
water measurements. The relationship
between a well site and its measurement data is generally one-to-many. Furthermore, a well may be measured more than
once in a given year. This can present a
challenge if an analysis goal to review or interpolate water-level surfaces
over time and space for multiple years. The
“Data Setup” option provides one way of processing the data for these types of
applications. The final result from the
Data Setup page is a simplified data set where each well has a single
measurement per year.
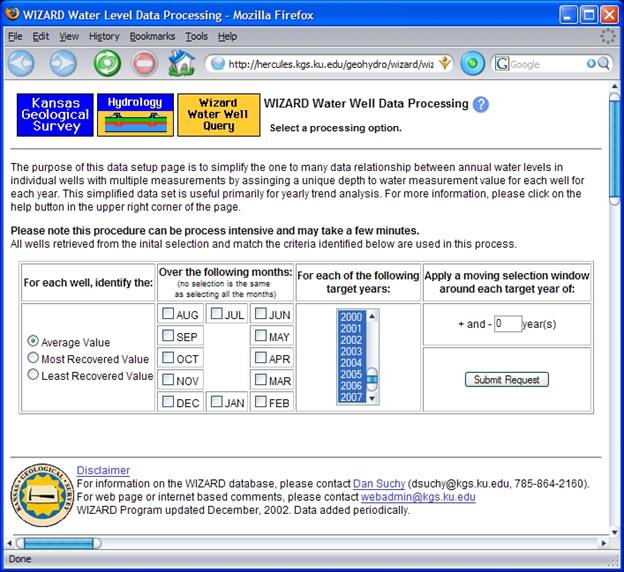
The
Data Setup page provides options for methods of determining a single yearly
depth-to-water value, defining the time period (within a year) over which a
single yearly depth to water value is to be determined, choosing “target” years
of interest, and an option to apply a moving selection window around each
target year. These options are discussed
below.
Determination of a Single Yearly Depth to Water Value
The
choices of determination method are in the from of three radio buttons that
enable users to choose between the average, most recovered, and least recovered
depth to water values for a yearly measurement value for a well over a chosen
period(s) within the year.
The
“most recovered value” is the shallowest (smallest) depth to water value, the
“least recovered value” is the deepest (largest) depth to water value, while the
“average value” (the default) option is the average depth to water over the
chosen time period.
Choosing the Time Period(s)
Time periods within each
target year that the average, most or least recovered depth-to-water values can
be further restricted to the month of the measurements.
In
the example above, if a single period consisting of the contiguous months of
December, January, and February is chosen, the period will be treated as the
“winter” months. For “winter” month periods,
the December measurements of the PREVIOUS year, in association with the January
and February measurements of the CURRENT year, are considered for computations.
For example, for the year 1995, the
measurements in December 1994, January 1995, and February 1995 will be selected
and processed (averaged, etc.) to represent a single 1995 depth to water value. Non-contiguous sequences, such as (January,
February), (August, September) may also be chosen, yielding more than one (in
this case two) time periods within the year.
If no months are chosen, the time period for determining a yearly
representative depth to water value for a given well will be the entire year.
Choosing Target Years of Interest
The target years of interest
are those years for which the average, most, or least recovered depth-to-water
values within the specified months are to be computed.
To
select multiple years, hold down the CNTRL key while clicking on the years in
the list. To choose a block of years, as shown above, click the earliest year
in the block, then hold down the SHIFT key while clicking the latest year in
the block. All of the available years
may be chosen in this manner as depicted in the image above. The available years are determined from the
date range entered in the WIZARD Well Selection Page or, if no date range was
specified, every year present in the database for the well selection will be
available.
Applying a Moving Selection Window Around Each Target
Year
This
option allows the consideration of a larger selection window around the target
years to determine a representative yearly depth-to-water value. The number of years before and after the
target year increases the size of the window of processing. For example, users may choose a one-year
window around each target year to represent a 3-year moving average around the
target years.
By
applying a value for the moving selection (or averaging) window, all the
measurements for a given well for a time interval centered on the target year
will be processed. For example, a moving selection window of 1 year centered on
the target year of 1995 will allow all measurements that were taken in 1994,
1995, and 1996 for a well to be selected and then the average, most recovered,
or least recovered depth-to-water measurement determined for each well. The resulting
single values will then be assigned to the selected wells to represent the year
1995.
The
principal use of this moving selection is to maintain a larger well count for
long-term trend reviews. In many cases,
a well may not have been measured for a variety of reasons (e.g., the well was
being pumped) that would cause a target year to be missing from a trend
analysis. Applying a moving window
allows that missing year of water-level data to be based on the surrounding
years where successful measurements were taken.
Submit Request
Once
the data setup options have been specified, clicking on the “Submit Request”
button produces a link (near the bottom of the data setup window) to a
comma-delimited text file containing the representative depth-to-water values
determined for each chosen year for each well.
The measurement selection or averaging process may take several minutes,
depending on the number of selected wells, the number of years chosen, and the
yearly measurement determination method.
Right-clicking on the link and choosing “Save Link As …” from the
context menu will enable users to save the file to a disk. Left clicking on the link will cause the text
file to be displayed in a new window.
This
linked file contains a single record per well.
Each record consists of the well’s USGS_ID followed by the
representative depth-to-water values determined for each chosen year. If no depth-to-water values could be determined
for a well for a given year (due to lack of measurements), the depth-to-water
for that year is assigned the value -9999.99.
A header record consisting of the item names is present at the top of
the file.
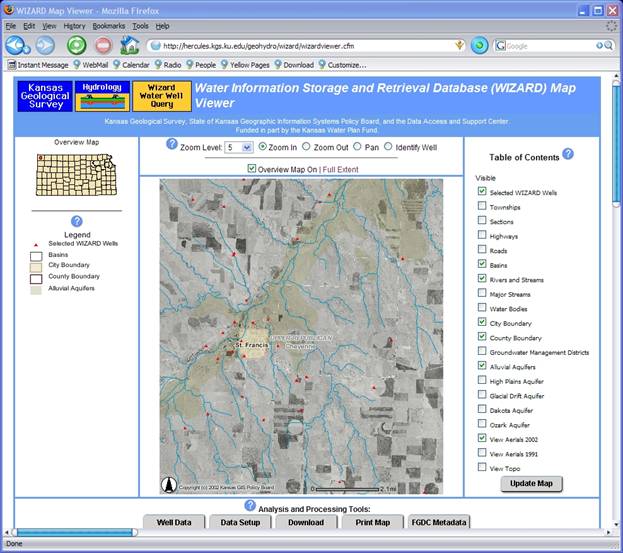
Create Map
Clicking on the “Create Map”
button on the WIZARD Well Listing Page or selecting the “Pass search results to
MAPPING page” check box on the Well Selection Page enables selected wells to be
displayed on an interactive map. A
typical display is shown below:
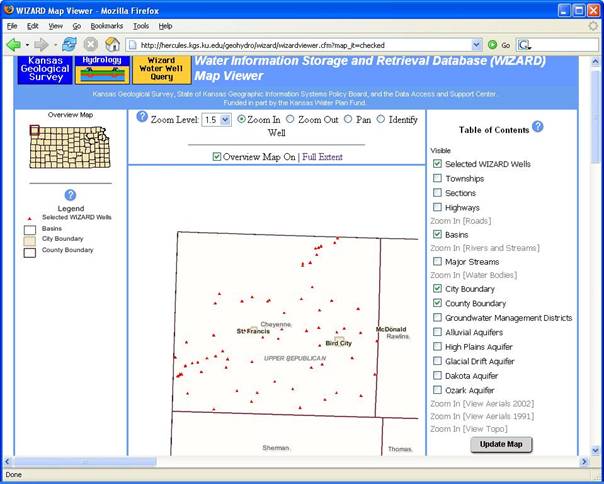
In
this figure, wells selected in Cheyenne County are displayed.
The wells are displayed as small red triangles. In the rightmost panel
of the map, options are provided to display the selected wells and various supporting
base map components such as county boundaries, townships, sections, highways,
major streams, Groundwater Management Districts, aquifers, etc. In the leftmost panel is an “overview” or
“locator” map followed by the map legend.
In lower center panel is the map display area and in the top center
panel are tools with which the user may control and interact with the map display
area. These components are discussed in
detail below:
Map Tools and Map Display Area
The
lower central panel of the Mapping Page is a map display area that can be interacted
with through the use of the map tools in the top panel.
The
zooming tools are in the form of radio buttons in the top panel. A tool is
activated by clicking the appropriate radio button, and then applied by
clicking within the Map Display Area.
The
Zoom In tool allows users to zoom in
closer on the map by clicking once on the map display. The map display will be centered on the
clicked location and the entire display will zoom in depending on the Zoom Level (see below). If
one zooms in far enough, there may be changes in the categories of map features
that are displayed. Finer map resolution
allows more map details to be observed.
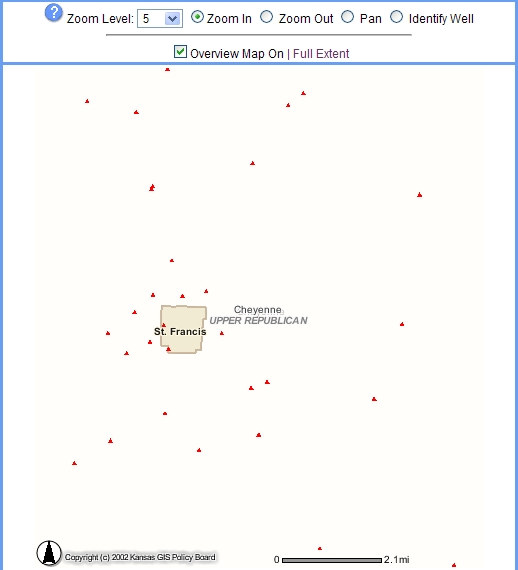
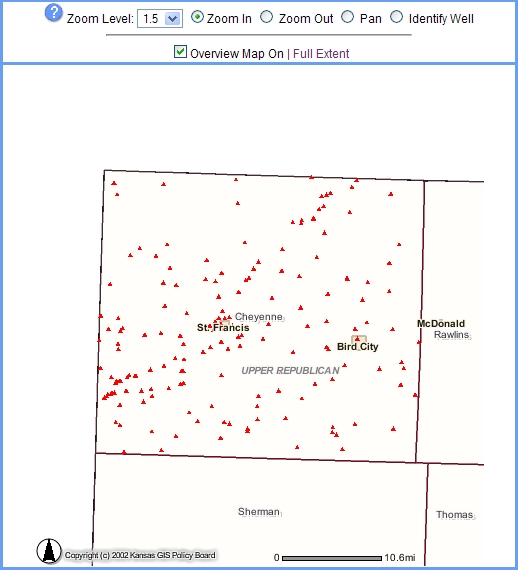
In
this example the “Zoom In” tool was used to click near the center of the
original map display above (when the zoom level was set to 5). Comparison of the maximum distances on the
scale bars (lower right corner of map) of the two maps (2.1miles in zoomed map vs.
10.6 miles in original) indicates that the map scale was increased by a factor
of roughly 5.
The
Zoom Out tool enables one to “zoom
out” farther away on the map display, thus decreasing the scale of the map and,
depending on the map resolution, causing less map detail to be observed. The use of the “Zoom Out” tool is the same as
that of the “Zoom In” tool. When zooming
out, there may be changes in the base map layers available for display on the
map.
The
Pan Tool enables the location on the
map to be moved in any direction without changing the map scale. To use this
tool, click its radio button and then click on the new map location. The new location becomes the new center of
the map.
The
Identify Well tool is a link to the
WIZARD Well Details Page (see previous section above) for a specific well on
the map. Clicking on a well in the map
display causes the WIZARD Well Details Page to be displayed in a popup window.
The page contains detailed information for the well that was clicked.
Checking/Un-checking
the “Overview Map On” checkbox toggles the display of a
locator map called the “Overview Map” at the top of the left panel. The locator map allows the user to see the position
of the display area relative to the entire state. The current map extent is indicated by the
red rectangle on this locator map. The
overview map will update dynamically as the map display changes.
Clicking
the Full Extent link causes the map
to be displayed at its original scale.
Overview Map and Legend
Below
the Overview Map at the top of the leftmost panel is the map Legend, which denotes the symbols for
all feature categories (such as roads, streams, counties, etc.) that have been
made visible by checking the appropriate boxes in the table of contents. The legend enables users to distinguish
categories of map features. Only those feature categories (layers) that have
been checked in the table of contents have a legend symbol. The symbology for map categories is static
and can not be changed.
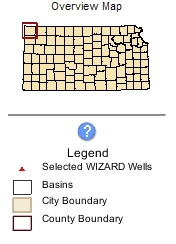
Table of Contents
In
the rightmost panel is the Table of Contents (TOC). The TOC is a list of available map layers
(feature categories) preceded by checkboxes.
The checkboxes toggle the layer’s visibility status in the map display.
Checking a layer’s box turns the layer on while un-checking the box turns the
layer off. Once the visibility status
for the layers has been set, click the Update
Map button at the bottom of the TOC to refresh the map display area.
Excluding
aerial photos and topographic maps, the symbology of visible layers is shown in
the legend portion of the map display. Several
of the layers are only available at certain map scales. For example, viewing aerial photos is not an
option when zoomed out to a county scale.
Other Map Options
At
the bottom of the WIZARD map viewer is the Well
Data button, which, when clicked, opens the WIZARD Well Listing Page in a
separate window. Other controls at the
bottom of the viewer are the Data Setup,
Download, and FGDC Metadata, and
Print Map buttons. The first three are discussed in previous
sections of this report. The Print Map button allows users to create
a map that is suitable for printing by providing several pre-print options (shown
below).
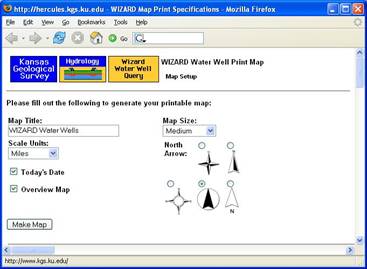
From
this page, users can choose the map title, scale units, and size of the actual
map (Small, Medium, Large, or Extra Large).
The style of North Arrow can also be selected and if the overview map
and the current date should be displayed.
Clicking the Make Map button
causes the printer-friendly map to be displayed in a window. The map can then be printed by choosing
“Print” from the file menu of the browser.
Conclusions
The
WIZARD database consolidates ground-water well site locations and
depth-to-water measurements from a variety of local, state, and federal sources
and represents the most inclusive listing of water-level information in Kansas. The web site provides a real-time data access
portal containing a host of selection, analysis, and mapping functions. WIZARD-based data facilitates scientific
analysis that includes the determination of saturated thickness, depth to
water, water-level trends, and water-resources predictions.
.
References
Hausberger, G., Davis, J., Miller R., Look, K.,
Adkins-Heleson, D., Ross, G., Bennet, B., Schloss, J.,
Bohling,
G., 1998. WISARD: Water Information Storage and Retrieval Database, Kansas
Geological Survey Open File
Report 1998-13.
Woods, J. J., Schloss, J. A., and Macfarlane, P. A., 2000. January
2000 Kansas water levels and data related to water-level changes,
Kansas Geological Survey, Technical Series 15, 89 p.
Appendix A:
Some Item Definitions and Codes
Well Site-specific Database Items:
Below are definitions of most
of the well-related items listed on the Wizard Well Details Page along with some
associated fields. The labels are those
used on the details page.
USGS ID The
unique 15-digit well identifier. It is initially
based on the latitude and longitude (degrees, minutes, seconds) of the well
site, but should not be considered a locator.
County The
name of the county in which the well is located.
HUC 8 Code The
8-digit Hydrologic Unit Code for the Office of Water Data Coordination catalog
unit which the site is located in. The
8-digit code consists of four
Parts:
1) Hydrographic region code; 2) Sub region code designated by the Water
Resources Council; 3) Accounting unit within the National Water
Data
Network; and 4) Cataloging unit of the USGS’s "Catalog of Information on
Water Data".
Longitude The (NAD 1983) longitude
of the well location in decimal degrees.
Latitude The (NAD 1983) latitude
of the well location in decimal degrees.
Lat/Long Accuracy Accuracy of latitude and longitude
coordinates (in seconds).
Lat/Long Source Indicates
source of longitude and latitude coordinates (see code definitions below).
KGS Local Well ID (Also
referred to as the KGS Local Well Number.)
This well identifier is composed of
the township, range, section number, up to four levels of qualifier/subdivision
(see below), and a well number (a unique ID that distinguishes different wells
at the same PLSS location). For example,
if a well has a local well ID of 05S 30W 23CDD 01, it is located in the
township at (05S, 30W), is within section 23 at the SE quarter (D) of the SE
quarter (D) of the SW quarter (C) of this section. Furthermore, among the wells
at this PLSS location, it has been assigned a well number of “01”. For more information on the PLSS and to see a
reference map, see the KGS PLSS Public
Information Circular (http://www.kgs.ku.edu/Publications/pic20/pic20_1.html).
PLSS Description Similar
to the local well ID but without the township direction and well number and
with the “spot” designation (described
below).
Township The
vertical (N-S) coordinate of the PLSS grid of townships. Township values range
from 1 in the north to 35 in the south in Kansas.
Township Direction Always south (S) in Kansas.
Range The horizontal
(E-W) coordinate of the PLSS grid of townships.
In Kansas,
range
values vary from 1 to 43 moving westward and from 1 to 25 moving
eastward from the Sixth Principal Meridian.
Range Direction All
townships west of the Sixth Principal Meridian have a range direction Value of “W” (West) while all those east of this
meridian have a range direction of “E” (East).
Section Most PLSS townships are
divided into 36 one square mile sections.
Subdivision Each
section can be divided into four quarter sections, and each quarter section may
be divided into four quarters and so on.
Within WIZARD, up to four levels of division of a section are possible. The quarters are designated A (NE), B (NW), C
(SW), and D (SE). They are listed from
the largest (leftmost) to the smallest (rightmost) levels of subdivision. For example, the subdivision designation of CDD,
the C or SW quarter is the largest subdivision.
Spot Alternate
subdivision designation in which the subdivisions appear from the smallest to
the largest. For example, the subdivision designation of CDD would have a spot
designation of SESESW with the SW quarter being the largest subdivision.
Depth of Well
Depth of the completed well, in feet, below the land surface.
Surface Elevation Altitude (in feet above sea level) of
the land surface at the well site location.
Geological Unit Codes Designate
the geological units that the well is screened in. Up to three codes are assigned per well (see code definitions below and Woods et. al.,
2000).
GMD The
Groundwater Management District (GMD) number in which the well site is located.
USGS Map Name Name
of 7.5 minutes (1:24000 scale) USGS topographic quadrangle map the well is located
in.
Measuring Point The
spot on the well where the measuring device, such as a steel tape, is inserted
to obtain a depth to water value. The
height of the measuring point is the distance, in feet, above or below the land
surface datum. The Measuring Point’s description is used to help locate it on
well.
Use of Site The
primary or principle use of the site or the purpose for which the site was
constructed. For site use codes, see “USE_OF_SITE_PRIMARY”
in the WIZARD
metadata (http://hercules.kgs.ku.edu/geohydro/wizard/wizardfgdc.html).
Use of Water
The primary or principal use of water from the site. For water use codes, see
“USE_OF_WATER_PRIMARY” in the WIZARD
metadata.
Remarks General comments about well
site.
Depth-to-Water Items:
Tape Hold Also
called the “stop depth” the tape hold is the amount of steel tape, in feet, inserted
into the well and held at the measuring point.
Chalk Cut The
value on the steel tape at which the chalk was marked by the water table.
Depth To Water The
depth, in feet below the land surface, to the water table in the well. Depth to water is calculated by subtracting
the Chalk Cut value and Measuring Point Height from the Tape Hold. For graphing purposes, values are shown with
negative signs to indicate depth below the land surface.
Date The
date on which the depth to water measurement was taken.
Status Water
level status code indicating any special conditions at the time of the
measurement.
Agency The agency responsible for the measurement.
Method A
code indicating how the water level was measured (see code definitions below).
WL Source Indicator
of the source of the water level measurement.
In particular, measurements taken by the general public. Has value “U” if unverified volunteer
measurement, V if verified or reviewed volunteer measurement.
Initials Initials of the
individual responsible for the measurement.
Items Related to Measuring Points
Height The height of the measuring point in feet
above or below land surface.
Description A
short description of the measuring point to facilitate its location on the well
site.
Items Related to Other Well Identifiers
Well Identifier Identifiers or classifications
that other agencies have assigned to the well.
Assignor The assignor of the well
identifier. This may be an agency, a
well network,
a project, etc.
Date Assigned The date on which the assignment
of the identifier was made.
Items Related to Well Construction
Date The date on which construction of the
well was completed.
Construction Method A code that indicates the method by which
the site was constructed. For code
definitions, see
“CONSTRUCTION_METHOD” in the WIZARD metadata.
Type of Finish A code that indicates the method
of finish or the nature of the openings that allow
water to enter the well. For code definitions, see “TYPE_OF_FINISH”
in the WIZARD
metadata.
Surface Seal A code indicating the type of
material used to seal the well so that surface water
does
not enter the well. For code
definitions, see TYPE_OF_SURFACE_SEAL” in the WIZARD
metadata.
Depth to Bottom of The depth to the bottom of the seal in
feet below land surface.
Seal
Development Method A code indicating the well development
method. See
DEVELOPMENT_METHOD
in the WIZARD
metadata for code definitions.
Development Hours The
length of time (in hours) that the well was bailed, pumped, etc., for development.
Special Treatment A
code indicating any special treatment applied during well development. For code
definitions, see”DEVELOPMENT_SPECIAL_TREAT” in the WIZARD
metadata.
Items Related to Well Casing Information
Sequence 1: This number is assigned at the
time of data entry to keep data by record type in a logical order.
Sequence 2: A unique sequence number for
sites that share a common USGS_ID value. Generally caused by multiple
measurements.
Depth To Top The
depth to the top of section of casing, in feet below land surface. If the casing extends above the land surface,
the height of the casing above land surface is preceded by a minus sign (-).
Depth To Bottom The depth to the bottom of section of
casing, in feet below land surface.
Diameter The
inside diameter, in inches, of perforated or slotted pipe, the diameter of a
screen, or the diameter of the hole, if the well is a finished open-hole.
Material The
code indicating the type of material which the screen or other open section is
made. For code definitions, see “MATERIAL”
in the WIZARD
metadata.
Thickness The thickness of the casing
wall (in inches).
Some Code Definitions
Geological Unit Codes:
QA Quaternary alluvium
KD Cretaceous Dakota, Kiowa Formations,
and Cheyenne Sandstone
KN Cretaceous Niobrara Chalk
KJ Lower Cretaceous/Upper Jurassic
undifferentiated
PL Pennsylvanian Lawrence and Stranger Formations
TO Tertiary Ogallala Formation
QU Quaternary undifferentiated
JM Jurassic Morrison Formation
OU Ordovician Undifferentiated
Lat/Long Source Codes:
GIS Coordinates
determined by plotting within a Geographic Information
System.
GPS Coordinates
measured with a Global Positioning System (GPS).
GPS
(within 50 ft.) Coordinates
measured with a GPS within 50 ft. of the well site.
GWSI Coordinate values from
the USGS Ground Water Site Inventory
database.
LEO Coordinates
calculated from the well’s legal (PLSS) location
using
the LEO conversion program.
Water Level Status Codes:
A Measurement was
determined to be “anomalous” by KGS statistical
analysis.
B Only the year
and month were provided for the measurement date and
time
(defaults to first day of the month).
D The site was dry (no water level recorded).
E The site was flowing recently.
F The site was
flowing, but the head could not be measured (no
water level recorded).
G A
nearby site that taps the same aquifer was flowing.
H A
nearby site that taps the same aquifer had been flowing recently.
I Injector site (recharge
water being injected into the aquifer).
J Injector site
monitor (a nearby site that taps the same aquifer is
injecting
recharge water).
M The site was
plugged.
N The measurement
was discontinued.
O An obstruction
was encountered in the well above the water
surface (no
water level recorded).
P The
site was being pumped.
R The
site had been pumped recently.
S A
nearby site that taps the same aquifer was being pumped.
T A
nearby site that taps the same aquifer had been pumped recently.
V Foreign
substance was present on the surface of the water.
W The
well was destroyed.
X The
water level was affected by stage in nearby surface-water
site.
Z Other
conditions that would affect the measured water level
(explain in remarks).
Measurement Method Codes:
A Airline
measurement
B Analog
or graphic recorder
C Calibrated
airline measurement
E Estimated
G Pressure-gage
measurement
H Calibrated
pressure-gage measurement
L Interpreted
from geophysical logs
M Manometer
measurement
N Non-recording
gage
R Reported,
method not known
S Steel-tape
measurement
T Electric-tape
measurement
V Calibrated
electric-tape measurement
Z Other
Kansas Geological Survey, Geohydrology
Placed online July 6, 2007
Comments to webadmin@kgs.ku.edu
The URL for this page is http://hercules.kgs.ku.edu/geohydro/ofr/OFR2007_15/OFR_2007_15-1.htm