Appendix A of KGS OFR 2003-55C provides plots of the mean annual streamflow, total accumulated annual precipitation, and the trends in mean annual streamflow statistically adjusted for precipitation by KWO planning basin. Plots are provided for each unique gaging station and when possible, the composite trend for stations that had a mean annual streamflow value every single year from 1982 to 2001. The R-squared value, which is a measure of the statistical relationship between streamflow and the combination of annual accumulated precipitation and time, is also provided. A measure of the statistical significance in the trend line can be seen with the "Probt" value where if Probt is less than 0.1 indicates a significant trend.
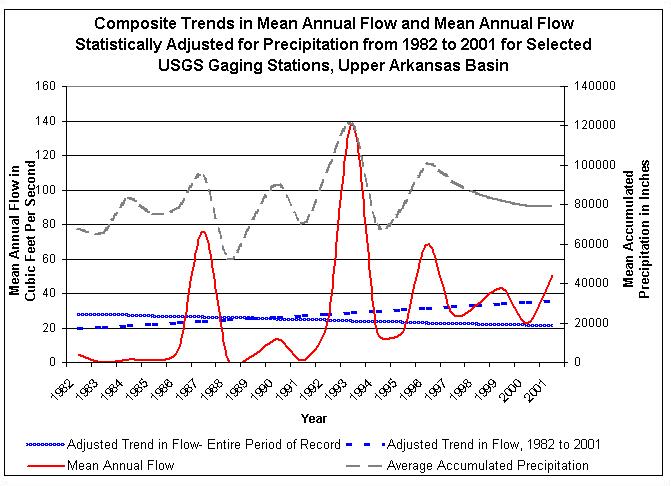
1982 to 2001 Composite Trend:
3 stations are used in this aggregated trend.
Average R-squared value: Entire Period of Record = 0.59526, 1982 to 2001
= 0.67320.
Probt Count: Entire Period of Record = 1 out of 3 stations, 1982 to 2001
= 1.
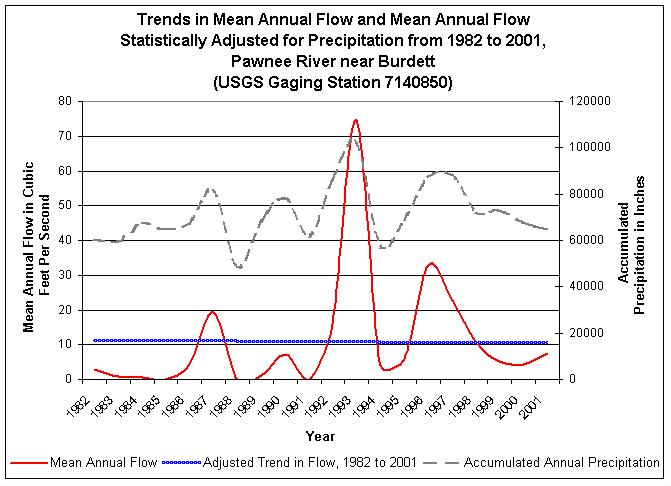
Station 7140850- PAWNEE R NR BURDETT, KS
| Entire Period of Record | 1982 to 2001 Time Period |
| R-Squared = 0.70801 | R-Squared = 0.70801 |
| Probt = 0.915057891007232 | Probt = 0.915057891007232 |
| Slope = -0.0436566007639475 | Slope = -0.0436566007639475 |
| Change in Trend is not statistically significant. | Change in Trend is not statistically significant. |
 Note-
Period of record for this gage is 1982 to 2001. Note-
Period of record for this gage is 1982 to 2001. |
|
Station 7141200- PAWNEE R AT ROZEL, KS
| Entire Period of Record | 1982 to 2001 Time Period |
| R-Squared = 0.62258 |
n/a
|
| Probt = 0.000000380605970518 |
n/a
|
| Slope = -3.04442774197894 |
n/a
|
| Change in Trend is statistically significant. |
n/a
|
 |
|
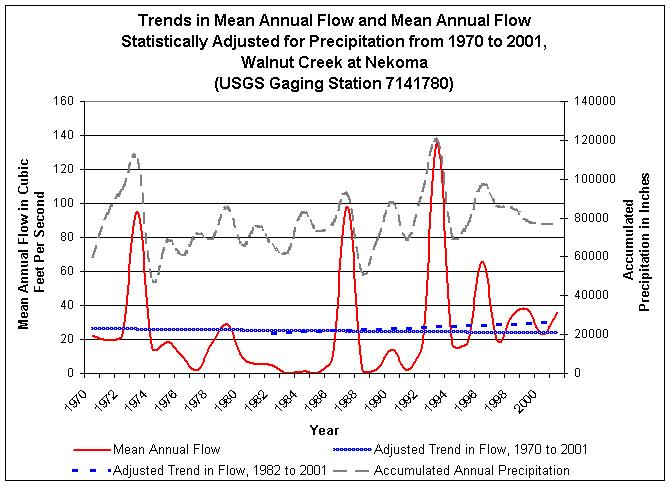
Station 7141780- WALNUT C AT NEKOMA, KS
| Entire Period of Record | 1982 to 2001 Time Period |
| R-Squared = 0.56243 |
R-Squared =
0.64048
|
| Probt = 0.850504685988587 |
Probt = 0.723415434778566
|
| Slope = -0.0804199195140443 |
Slope = 0.329512219923388
|
| Change in Trend is not statistically significant. |
Change in Trend
is not statistically significant.
|
 |
|
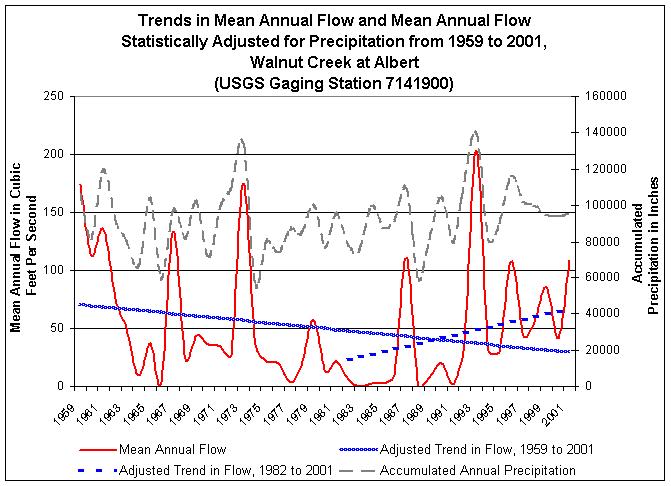
Station 7141900- WALNUT C AT ALBERT, KS
| Entire Period of Record | 1982 to 2001 Time Period |
| R-Squared = 0.51534 |
R-Squared =
0.6711
|
| Probt = 0.0431825467493105 |
Probt = 0.0994263781139417
|
| Slope = -0.981711167824185 |
Slope = 2.30852035729644
|
| Change in Trend is statistically significant. |
Change in Trend
is statistically significant.
|
 |
|